Infrastructure Monitoring Tools

As businesses rely increasingly on digital systems for everything from customer interactions to internal collaboration, monitoring those systems has never been more important. Infrastructure monitoring tools help IT teams keep an eye on performance, security, and resource utilisation across servers, networks, storage, and more. By spotting issues early - sometimes before end-users even notice - these tools reduce downtime, improve resource efficiency, and bolster overall reliability.
In this article, we’ll explore how infrastructure monitoring tools work, why they’re essential, and how to choose or implement the right solution. We’ll also reference previous discussions - such as Server Management and Network Infrastructure Management - to demonstrate how monitoring fits into a larger IT strategy. Whether you’re a local business on the Central Coast (NSW) or a nationwide enterprise, solid monitoring practices can save you countless hours of troubleshooting and keep productivity levels high.
What Are Infrastructure Monitoring Tools?
Infrastructure monitoring tools track the health and performance of IT components - servers, networks, virtual machines, containers, storage systems, and more - by collecting metrics, logs, and events. They often provide:
Dashboards: Real-time visualisations of CPU usage, memory consumption, disk I/O, network throughput, and other indicators.
Alerts and Notifications: Automated warnings if metrics exceed predefined thresholds (e.g., high CPU usage or abnormal traffic spikes).
Historical Data: Storing metrics over time allows trend analysis and capacity planning.
Reporting and Analysis: Some advanced tools include AI-driven insights or predictive analytics to suggest optimisations.
〰️
Dashboards
〰️
Alerts
〰️
Data History
〰️
Reporting & Analysis
〰️ Dashboards 〰️ Alerts 〰️ Data History 〰️ Reporting & Analysis
Monitoring tools can be agent-based (requiring software installed on each monitored device) or agentless (using protocols like SNMP or APIs to gather data). Either way, the goal is consistent: gather actionable insights to keep your infrastructure running smoothly.
Why Infrastructure Monitoring Matters:
Reduced Downtime
Quick detection of hardware failures, network congestion, or memory leaks prevents small issues from escalating into major outages.
Proactive Maintenance
Seeing early warning signs - like rising CPU temperatures or steadily increasing memory usage - lets you fix problems before end-users notice.
Optimised Resource Usage
Monitoring reveals underutilised servers or bloated processes, allowing you to reallocate or consolidate resources for cost savings.
Enhanced Security
Anomalies in traffic patterns or CPU spikes can signal a security breach. Alerting on unusual behaviour helps contain threats quickly.
Capacity Planning
Tracking trends over time indicates when you’ll need more disk space, bandwidth, or computing power, so you can budget and scale proactively.
Types of Monitoring
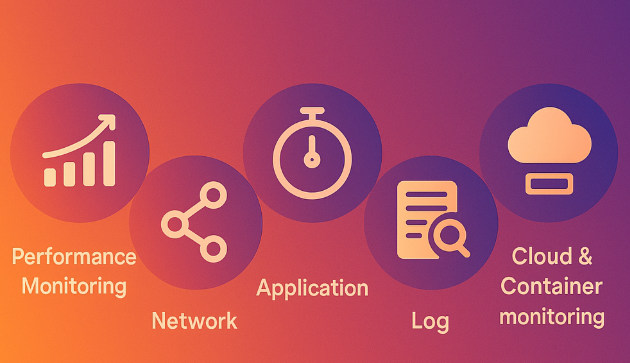
Performance Monitoring
What It Is: Tracking CPU, memory, disk I/O, and network usage for servers or containers to ensure they meet performance SLAs (Service Level Agreements).
Why It Matters: Sluggish apps often stem from resource bottlenecks. Performance metrics pinpoint exactly where to add capacity or tune configurations.
Network Monitoring
What It Is: Observing router, switch, firewall, and interface statuses (e.g., packet loss, latency, bandwidth utilisation).
Why It Matters: As highlighted in Network Infrastructure Management, a slow or unstable network degrades everything else - email, VoIP, cloud access, and more.
Application Monitoring
What It Is: Drilling down into app-level metrics, such as response times, request throughput, or error rates, often via APM (Application Performance Monitoring) tools.
Why It Matters: Even if the server is fine, an application-specific glitch (like an unoptimised query) can hurt user experiences.
Log Monitoring
What It Is: Analysing system and application logs (event logs, error logs, security logs) for anomalies, failures, or suspicious activity.
Why It Matters: Logs are a treasure trove of diagnostic info. They can reveal failed login attempts, software crashes, or misconfiguration issues.
Cloud and Container Monitoring
What It Is: Tracking usage and performance in dynamic environments - like Kubernetes clusters, Docker containers, or serverless functions.
Why It Matters: Elastic resources spin up/down automatically; real-time insight ensures you’re neither over-provisioning nor under-provisioning.
Key Features to Look For
When evaluating infrastructure monitoring tools, consider:
Ease of Deployment
Can you deploy agents (if needed) quickly? Does the tool integrate with your existing systems without complex setup?
Scalability
As your environment grows - new servers, containers, or services - can the tool handle the extra load without performance dips?
Customisable Dashboards and Alerts
Every business has unique performance thresholds. Look for solutions that allow tailored alerting or dashboards relevant to your specific use cases.
Historical Data and Reporting
Storing data over weeks or months is crucial for trend analysis. Advanced reporting can help forecast future capacity needs.
Integration with Other Tools
Does it link with ticketing systems, CI/CD pipelines, or collaboration platforms (e.g., Slack, Teams) for faster incident resolution?
Security and Role-Based Access
Monitoring often sees sensitive system info. Ensure the tool has robust authentication, encryption, and role-based permissions.
Popular Infrastructure Monitoring Tools:
Nagios
A veteran open-source platform known for plugin extensibility. Monitors networks, servers, apps, and logs, albeit with a steeper learning curve.
Zabbix
Another open-source option offering agent-based and agentless monitoring. Strong templating system for large deployments, plus auto-discovery.
Prometheus + Grafana
Prometheus scrapes metrics from endpoints, ideal for cloud-native or containerised environments. Grafana adds rich visualisations and alerting.
SolarWinds Orion
A commercial suite covering network, server, and app monitoring. Known for easy setup but can be pricier at scale.
Datadog
A SaaS platform providing unified monitoring for servers, apps, logs, and cloud services. Offers AI-driven anomaly detection and strong integrations.
New Relic
Focuses heavily on application performance metrics (APM), but also extends to infrastructure monitoring and log analysis.
Best Practices for Using Monitoring Tools

Define Clear Objectives
Why It Matters: Without a clear goal - like reducing downtime or ensuring a specific response time - it’s easy to get lost in metrics.
How to Do It: Establish SLAs and key performance indicators (KPIs) that align with user or customer expectations.
Start Small, Then Scale
Why It Matters: If you try to monitor everything at once, you risk alert fatigue and unmanageable dashboards.
How to Do It: Begin with critical services (e.g., production servers, core routers). Expand incrementally, refining alerts and thresholds along the way.
Set Meaningful Alerts
Why It Matters: Too many false positives breed complacency. Too few alerts miss real incidents.
How to Do It: Tailor thresholds (e.g., CPU usage over 85% for five minutes) and escalate to more urgent channels (SMS, phone call) for critical issues.
Integrate with Incident Response
Why It Matters: Quick identification of a problem is useless without a defined resolution process.
How to Do It: Link alerts to help desk or incident management systems like Jira, ServiceNow, or Slack. Document escalation paths and on-call rosters.
Leverage Historical Data
Why It Matters: Today’s anomaly might be tomorrow’s new normal if your user base doubles or you shift to a new app architecture.
How to Do It: Analyse graphs over months or years to spot gradual trends, plan hardware upgrades, or justify budget requests for expansions.
Common Monitoring Challenges
Alert Noise
Problem: Overly sensitive thresholds trigger constant false alarms, causing IT staff to tune out or ignore them.
Solution: Fine-tune metrics. Use advanced logic - like “trigger alert if CPU > 85% for at least 10 minutes” - to prevent knee-jerk notifications.
Tool Overload
Problem: Using multiple disjointed tools for servers, networks, logs, etc. leads to scattered data and lack of a unified view.
Solution: Consolidate or integrate tools into a single platform or dashboard. Evaluate solutions that offer end-to-end visibility.
Complexity in Hybrid/Multicloud Environments
Problem: Monitoring on-prem servers, multiple public clouds, and container clusters can be intricate.
Solution: Pick or build solutions that handle distributed environments gracefully, ensuring each resource is polled and reported consistently.
Skills Gap
Problem: Configuring advanced queries, custom metrics, or AI-driven anomaly detection demands specialised knowledge.
Solution: Training, documentation, or partnering with a Managed IT Services provider adept in these tools.
For more general IT challenges, see our post on Common Challenges in Managed IT.
Role of Managed IT in Infrastructure Monitoring
A Managed IT Services provider can simplify monitoring deployment and ongoing operations:
Setup and Configuration: Experts tune thresholds and alerts for your specific workloads, avoiding guesswork.
24/7 NOC (Network Operations Centre): MSPs often staff a NOC that reacts to alerts around the clock.
Continuous Improvement: With experience across various clients, MSPs can advise on best practices or advanced features like predictive scaling.
Incident Resolution: Instead of merely telling you something’s broken, they can fix it - streamlining the entire support process.
Reporting: Monthly or quarterly performance summaries highlight trends, capacity concerns, and recommended optimisations.
If outsourcing some or all of your monitoring duties appeals to you, see How to Choose a Managed IT Provider for selection tips.
Measuring the Effectiveness of Monitoring
Just as we discuss in Evaluating Managed IT Performance, success requires measurable outcomes. Possible metrics include:
MTTR (Mean Time to Repair)
Average time to resolve issues after detection. Shorter MTTR indicates efficient alerting and incident management.
MTTD (Mean Time to Detect)
How long it takes to notice problems initially. A robust monitoring setup minimises MTTD.
Alert Accuracy
Ratio of true positives (valid alerts) to false positives. Lower false positives mean better threshold calibration.
Coverage Gaps
Percentage of infrastructure or apps not covered by any monitoring. Achieving near-100% coverage reduces blind spots.
Reduction in Unplanned Downtime
Track how many hours of unscheduled outages occur each month or quarter. If monitoring is effective, that number should drop over time.

Why Partner with Zelrose IT?
At Zelrose IT, we see infrastructure monitoring as a cornerstone for reliable, secure, and future-ready IT environments. We offer:
Proactive Monitoring Tools: Using industry-leading platforms to keep tabs on servers, networks, and applications 24/7.
Tailored Dashboards and Alerts: We customise thresholds to reflect your performance objectives - whether for e-commerce uptime or internal productivity.
Continuous Optimisation: Our team analyses historical data to recommend resource allocations, capacity upgrades, or security improvements.
Rapid Incident Response: As a Central Coast (NSW)–based provider, we can combine remote alerts with swift on-site interventions if needed.
Clear SLAs: Know exactly what to expect in terms of response times, escalation procedures, and reporting frequency.
Ready to enhance visibility and control over your infrastructure? Reach out to learn how Zelrose IT can implement a comprehensive monitoring solution aligned with your specific needs.
Infrastructure monitoring tools are essential for any organisation aiming to minimise downtime, optimise resource usage, and swiftly address security or performance hiccups. By collecting and analysing metrics in real time, these solutions provide a level of visibility that proactive IT teams or Managed IT Services providers can leverage to keep systems stable and users happy.
Whether you lean on open-source solutions like Nagios or Prometheus, opt for commercial platforms like SolarWinds or Datadog, or combine multiple tools into a cohesive strategy, the key lies in thoughtful configuration and clear objectives. Setting the right thresholds, integrating with incident management workflows, and revisiting historical data for trends ensures you derive real value - not just noise - from your monitoring setup.
Want to shine a spotlight on your entire infrastructure?
Get in touch with Zelrose IT. We’ll help deploy or refine monitoring tools that deliver actionable insights - reducing downtime, enhancing security, and guiding smarter IT investments for the long haul.